Deploy the Prometheus Monitoring Stack, understand the components, and monitor containers

The wait is finally over let’s get monitoring.
Tasks:
Task 1: Deploy the monitoring stack
We will now deploy a complete monitoring stack based on the following services: Prometheus, node-exporter, alertmanager, cAdvisor, and Grafana. This monitoring stack is meant to be a kick start to help you get familiar with the tools and the setup.
This section we will walk through the various components and explain where and how to configure the docker Swarm stack for Prometheus.
-
For those using PWD Login to a different PWD and create a Docker account if you don’t already have one.
-
Clone the monitoring repository and change into the
prometheusdirectory
  git clone https://github.com/vegasbrianc/prometheus.git
  cd prometheus
- Deploy the Prometheus monitoring stack
docker stack deploy -c docker-stack.yml prom
-
Next, we will head over to the Prometheus stack project. Open Prometheus Monitoring Stack in a new tab.
-
Let’s have a look at the different components deployed
Prometheus: An open-source monitoring and alerting application that stores time series data with a powerful query language. Prometheus is pull based collection of metrics.
node-exporter: A Prometheus Exporter for hardware and OS metrics for *NIX kernels.
Alertmanager: The Prometheus Alertmanager handles alerts sent by client applications and routes them to the proper receiver (email, SMS, Pager Duty, etc)
cAdvisor: The Container advisor collects metrics for all the running containers on each host which it runs.
Grafana: The open-source dashboard visualization tool
-
Open the deployed components
Prometheus:
http://0.0.0.0:9090node-exporter:
http://0.0.0.0:9100/Alertmanager:
http://0.0.0.0:9093/cAdvisor:
http://0.0.0.0:8080/Grafana:
http://0.0.0.0:3000/user -
adminpassword -foobar
Task 2: Prometheus Walkthrough
Now that we deployed the Prometheus Monitoring stack let’s have a look at what is running:
- Configs CLI / UI:
- In your Terminal Navigate to the
Prometheus/prometheusdirectory and open theprometheus.yml. Here is where we can define which targets to scrape. - In your terminal
- In the Prometheus UI Click the Status menu - > Command-Line Flags (Provides commands passed to Prometheus via the
docker-compose.ymlfile) - In the Prometheus UI Click the Status menu - > Configuration (Provides scrape target configuration informaiton)
- In your Terminal Navigate to the
- Targets
- Click the Status menu -> Targets (Provides health status of Targets)
- Click the Status menu -> Service Discovery (Displays which services are being queried for Service Discovery)
- Alerts
- In the Promethues UI Click the Alerts Menu and expand the alerts.
- Graph:
- In the Prometheus UI Click the Graph Menu.
- Select the last metric in the list
upfrom the drop down list and clickExecute - Click on the following link which runs several Prometheus Queries (For PWD users change 0.0.0.0 to your PWD URL) http://0.0.0.0:9090/graph?g0.range_input=1h&g0.expr=up&g0.tab=0&g1.range_input=1h&g1.expr=container_cpu_load_average_10s%7Bcontainer_label_com_docker_swarm_node_id!%3D%22%22%7D&g1.tab=0&g2.range_input=1h&g2.expr=container_memory_usage_bytes%7Bcontainer_label_com_docker_swarm_node_id!%3D%22%22%7D&g2.tab=0
INFO: Prometheus does not contain Users and Roles Access Control (RBAC). It is recommended that you deploy a proxy in front of Prometheus in order to protect your deployment with users/passwords.
Task 3: Getting Familiar with Grafana
Grafana is an amazing tool which is easy to configure and use. Since Grafana version 5.0.0 enables us to easily provision Dashboards and Datasources (Woohoo!). We will walk through the configuration of Grafana and in the next section start building Dashboards.
- Configs / Provisioning
- In your Terminal Navigate to the
Prometheus/grafanadirectory - Open the
config.monitoringfile. Here is where we set the inital password for Grafana
- In your Terminal Navigate to the
-
Data Sources - All files placed in the
Prometheus/grafana/provisioning/datasourcesdirectory will be provisioned when runningdocker stack deploy. View theYAMLfile located in this directoy -
Dashboards - All files placed in the
Prometheus/grafana/provisioning/dashboardsdirectory will be provisioned when runningdocker stack deployView theYAMLfile located in this directoy which is the Dashboard configuration and theJSONfile is the dashoard itself. -
Login to Grafana
http://0.0.0.0:3000/user -
adminpassword -foobar -
Click the gear icon (Settings) in the left bar -> Data Sources
-
Open the Prometheus Datasource. Here we can see the settings provisoned from the
YAMLfile above. Notice the URL to the Datasource is the DNS name of the container. -
At the bottom of the screen click the
Backbutton - In the Datasource Menu select the Plugins menu
Task 4: Monitoring Containers / Hosts with the Prometheus Stack
In the final section we will build a Dashboard based on the Prometheus stack. We will create a simple Status Dashboard highlighting the Systems State, Containers performance, and Diskspace. Let’s do this!
Create Single Stat Uptime
- In the Grafana UI click the + -> Create Dashboard menu
- Select Single Stat
- On the Panel Title click the Menu -> Edit button.
- Click the Datasource option -> Prometheus
- Add the
time() - avg(node_boot_time_seconds)which takes the current time and subtracts it from the boot time to give us the average Uptime of all servers in the cluster - Click the Options Tab -> Set the unit to Time -> Seconds
- Set the Decimal to 0
- Click the General Tab and Rename the Panel to Uptime
- Save Dashboard
Create Single Stat Targets Online
- At the top right of the screen click -> Add Panel(looks like a graph) -> Single Stat button and move it next to the Uptime panel
- Add a new Single Stat
- On the Panel Title click the Menu -> Edit button.
- Click the Datasource option -> Prometheus
- Add the query
sum(up) - Click the Options Tab
- Check the Background box (Invert the colors if the background is Red)
- Set the threshold to
0,3 - Click the Value Mappings Menu
- Set the following Value Mappings:
- 3 -> Up
- 2 -> Down
- 1 -> Down
- 0 -> Down
- Click the General tab and rename the panel to
Targets Online - Save Dashboard
Create Memory Usage by Container Graph
- At the top right of the screen click -> Add Panel -> Graph button and move it below the single stat panels
- On the Panel Title click the Menu -> Edit button.
- Click the Datasource option -> Prometheus
- Add the Metric
topk(5, container_memory_usage_bytes{name=~".+"}) - To make the container names more readable add
{{name}}to the Legend Format field - Select the Axes Tab
- Change the Unit on
Left Yto Data (Metric) -> Bytes - Switch to General Tab
- Rename panel to
Memory Usage by Container - Switch to the Display Tab
- Under Mode options select Fill = 5
- Save Dashboard
Create CPU Usage by Container Graph
- At the top right of the screen click -> Add Panel -> Graph button and move it below the single stat panels
- On the Panel Title click the Menu -> Edit button.
- Click the Datasource option -> Prometheus
- Add the Metric
container_cpu_load_average_10s{image!=""} - To make the container names more readable add
{{name}}to the Legend Format field - Select the Axes Tab
- Change the Unit on
Left Yto None -> Percent (0-1.0) - Switch to General Tab
- Rename panel to
CPU Usage by Container - Switch to the Legend Tab
- Select values
AvgandCurrent - Under Options Select
ShowandTable - Save Dashboard
Change the time range
- The upper right hand corner of Grafana, select the quick range
15 minutes.
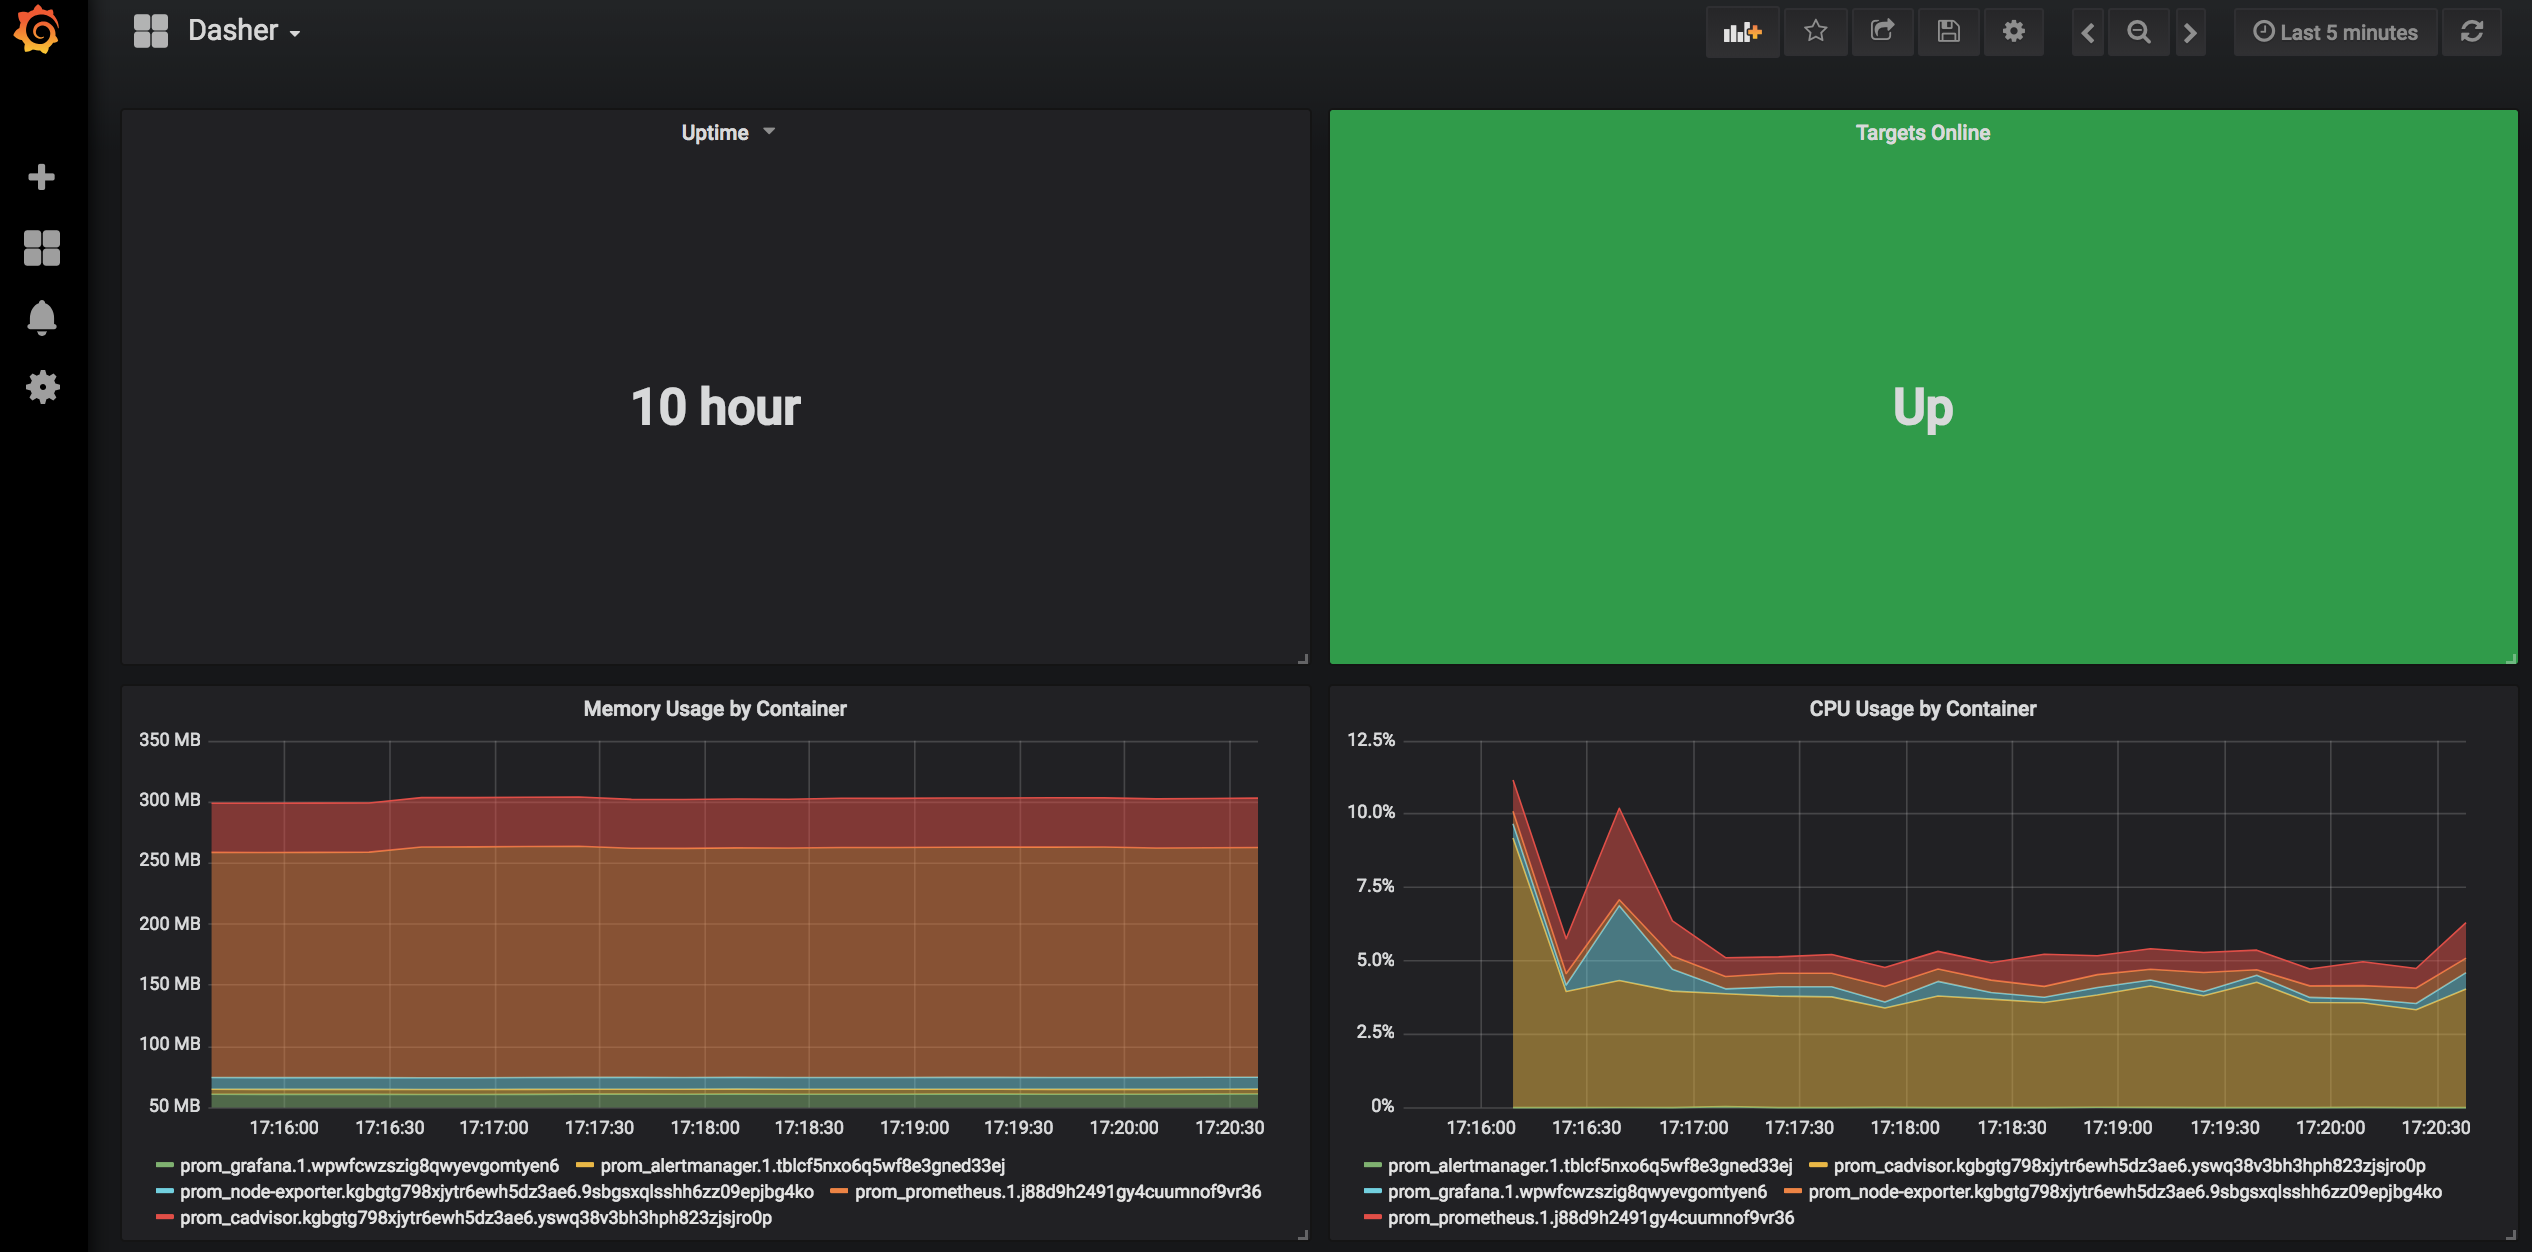
Here is what the final Dashboard should look like:
Import Dashboards
In the last section we can quickly import Dashboards from Grafana Dashboards
- In the Grafana UI click the
+-> Create Dashboard menu -> Import - Type in the ID# 395 or ID#893 and Click the
Importbutton - Select Prometheus as the Datasource New Dashboards Import Dashboard 395 & 893
- Now search Grafana Dashboards for a Docker Dashboard. Select a dashboard and find the ID# of the dashboard
- Import the Dashboad using steps 1-3 above
Recap
What did we learn in this section?
- Deploy Alertmanager, cAdvisor, Grafana, node-exporter, & Prometheus
- Explore the components of the Prometheus stack
- Familiarize with Grafana
- Build Grafana Dashboards
Slides / Links / Resources
For the next step in the tutorial, head over to Workshop Resources